Power BI Dashboards have innumerable uses. After all, data powers everything today, hence the need to understand it.
Reporting & Analytics
15 Best Splunk Dashboard Examples
Analyzing data allows managers to figure out what is working and what is not. But there is so much to parse. Internal data from the business’s inner structure and external data, crucial to its sustainability and expansion goals.
10 Best Free Data Visualization Tools
When it comes to representing any form of data, the best way is to use tools that will get the job done.
10 Power BI Alternatives For Mac
Microsoft released Power BI in 2011 as part of the Microsoft Power Platform. It is a business analytics platform that facilitates creating powerful data visualization and getting real-time business intelligence. The platform is highly scalable such that you can connect it with various data sources.
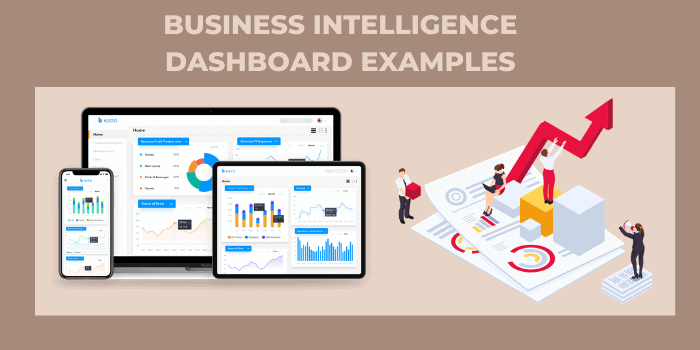
20 Business Intelligence Dashboard Examples
Business intelligence dashboards are a great way to track the performance of your business overall. You can view many metrics and data points in one place, allowing you to quickly see where your business is holding and where it is going.
15 Best Power BI Sales Dashboard Examples
Data visualization software enables you to turn any data into a visual story. A dashboard is a visualization of business-critical data, presented in an easily digestible format.

