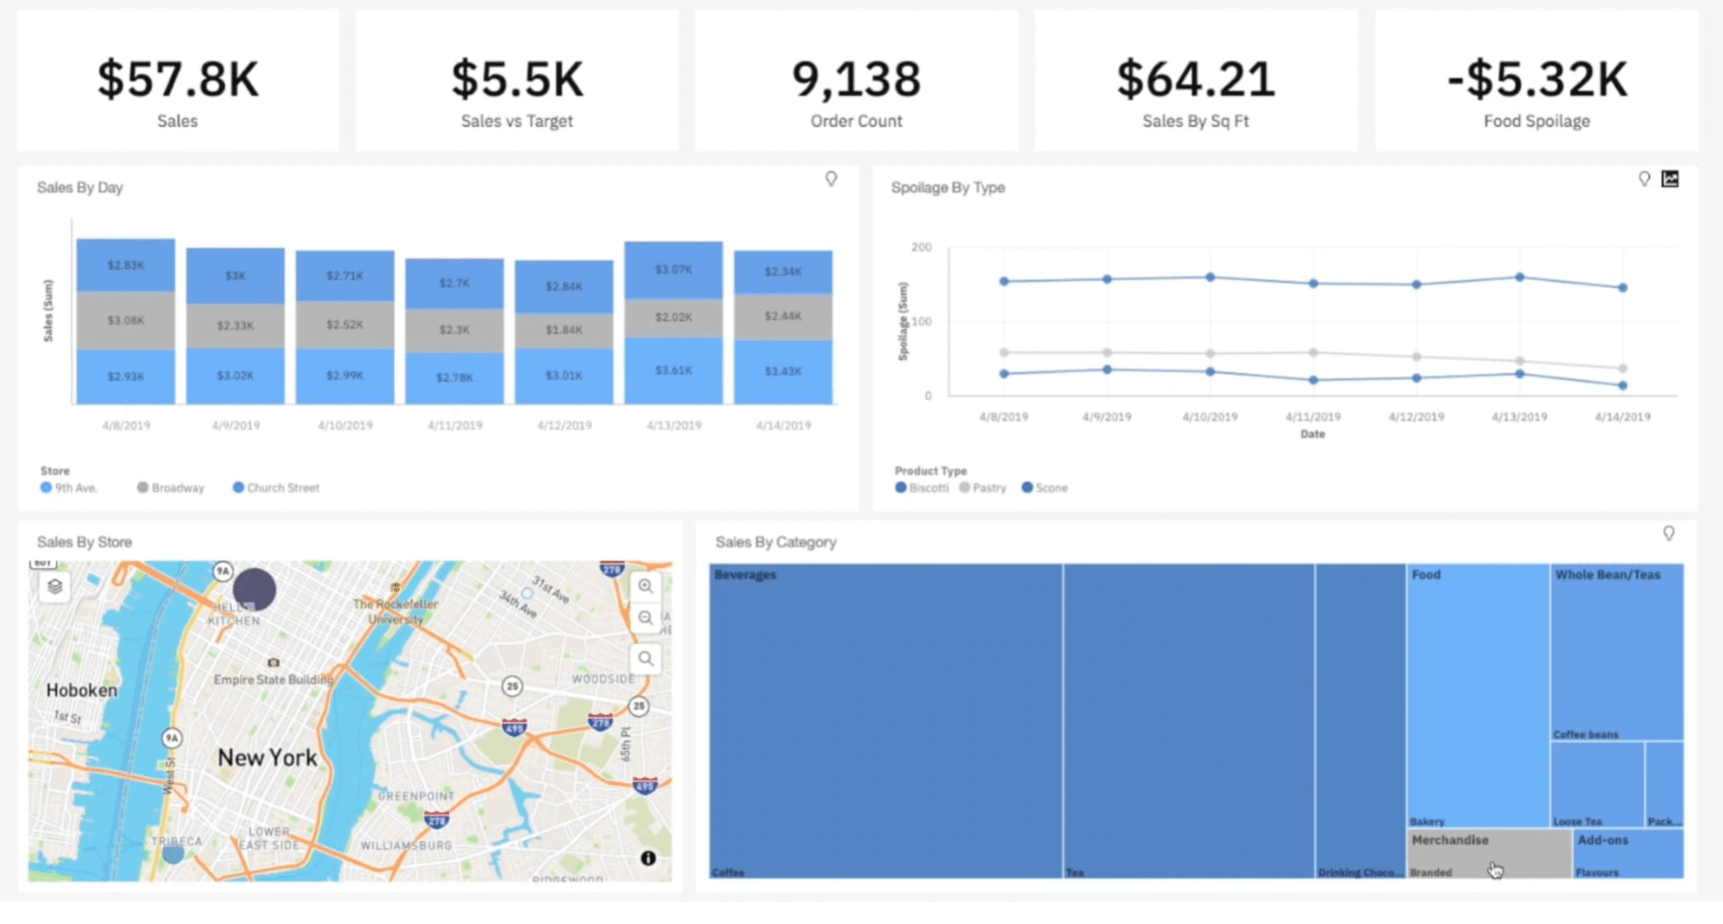
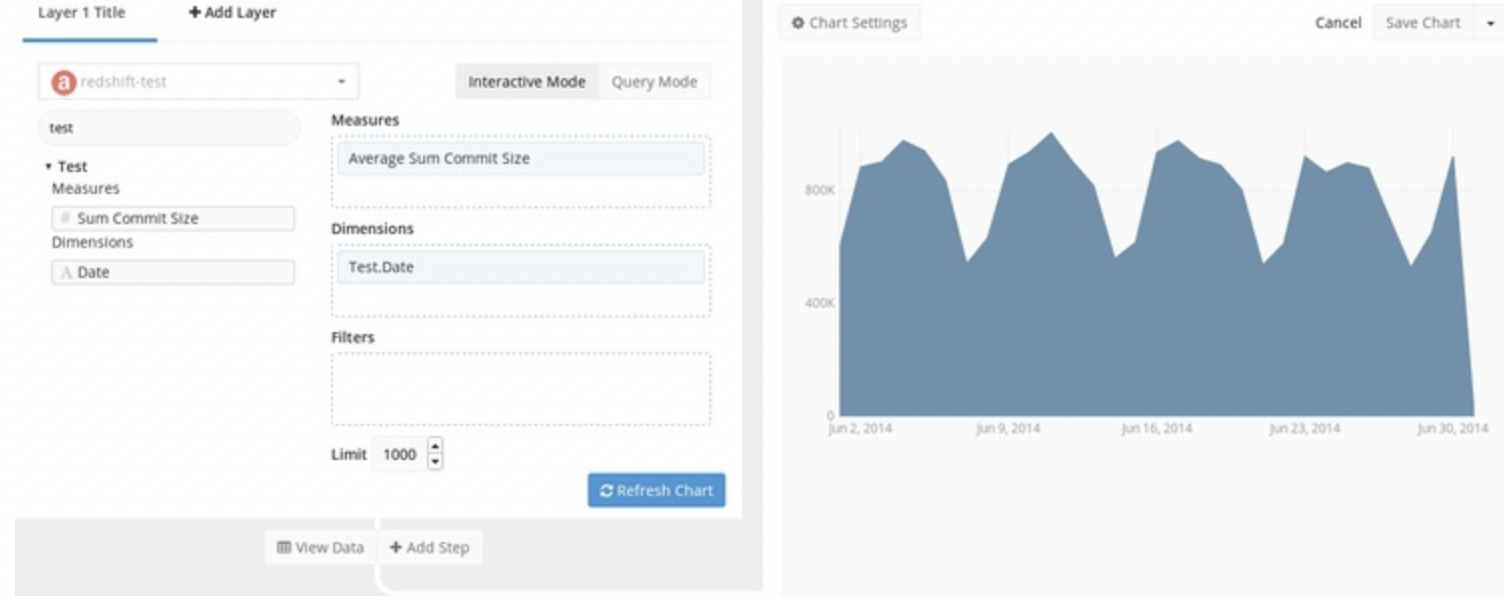
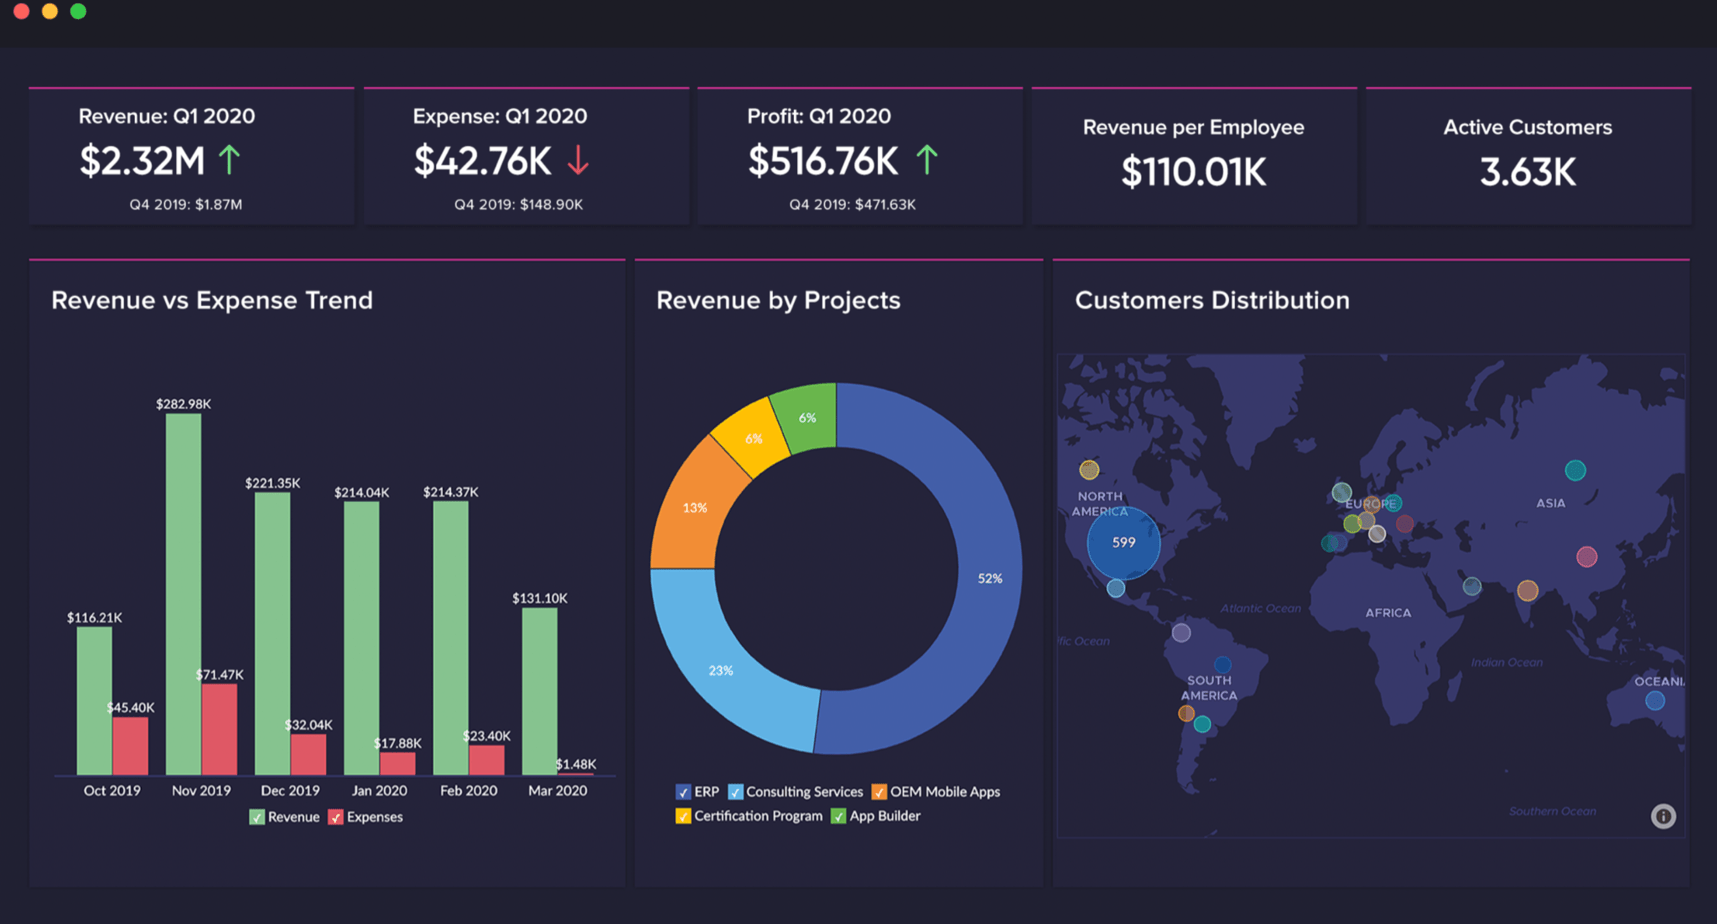
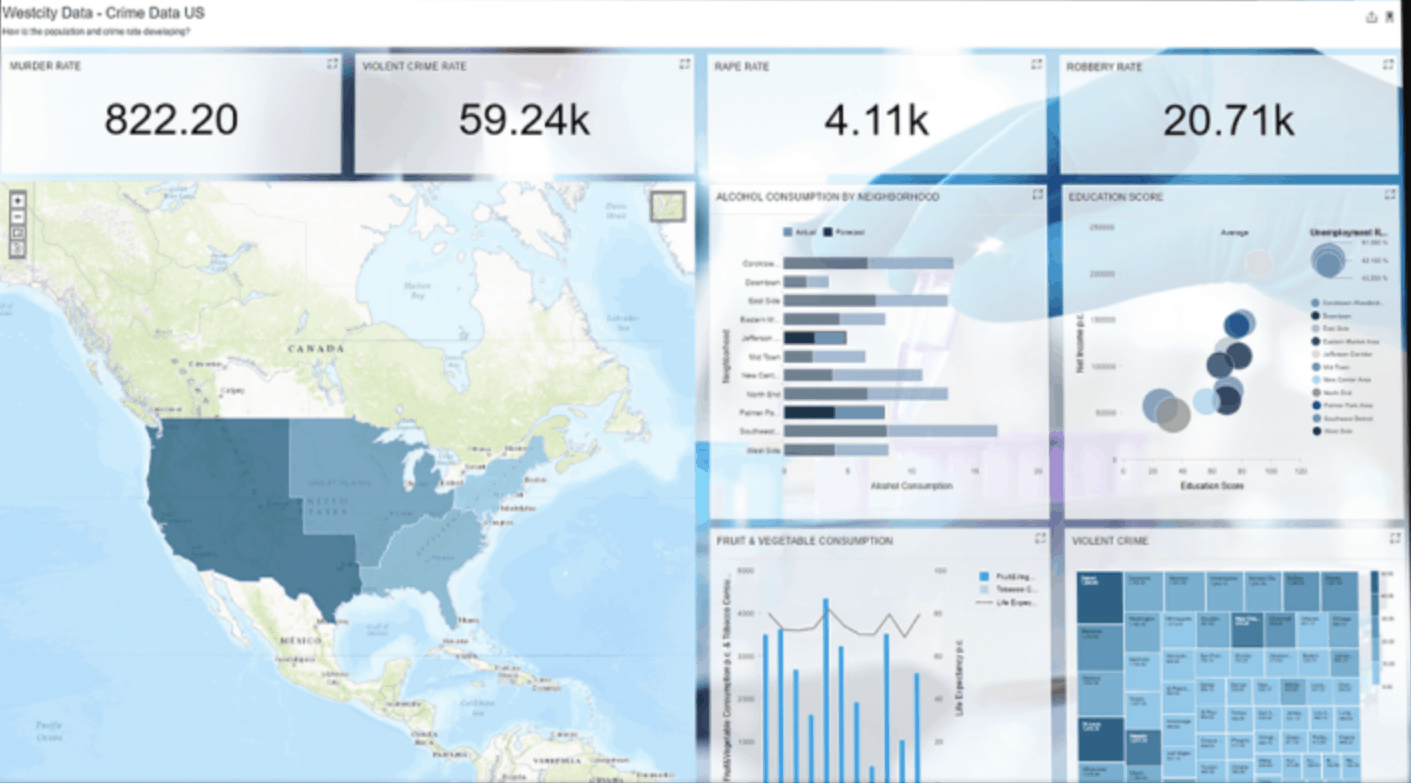
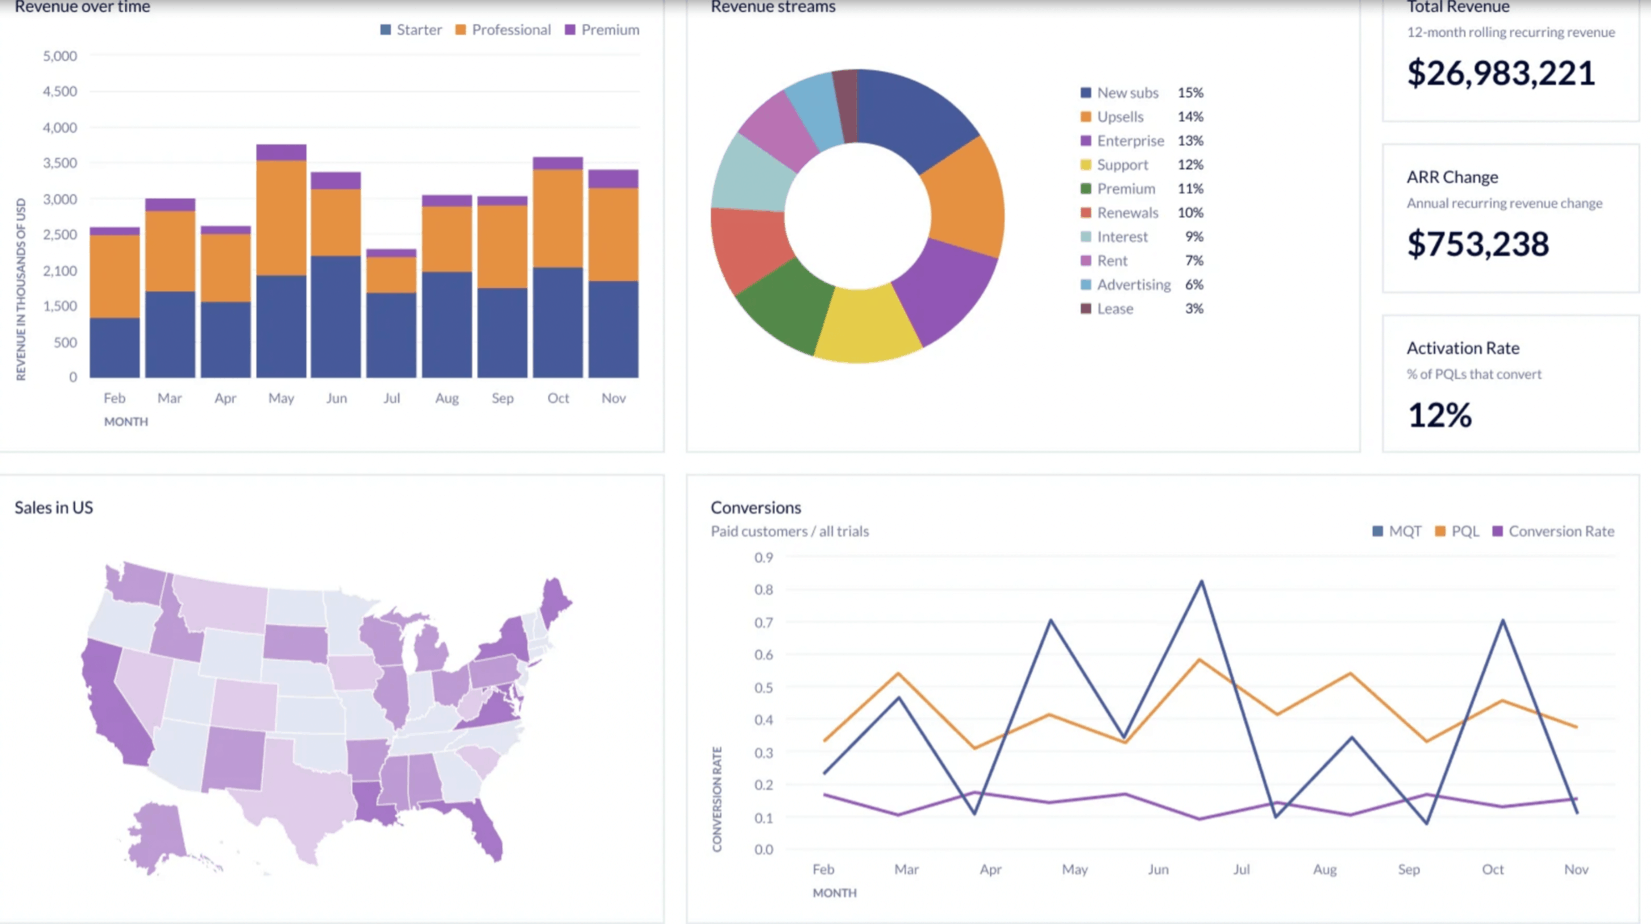
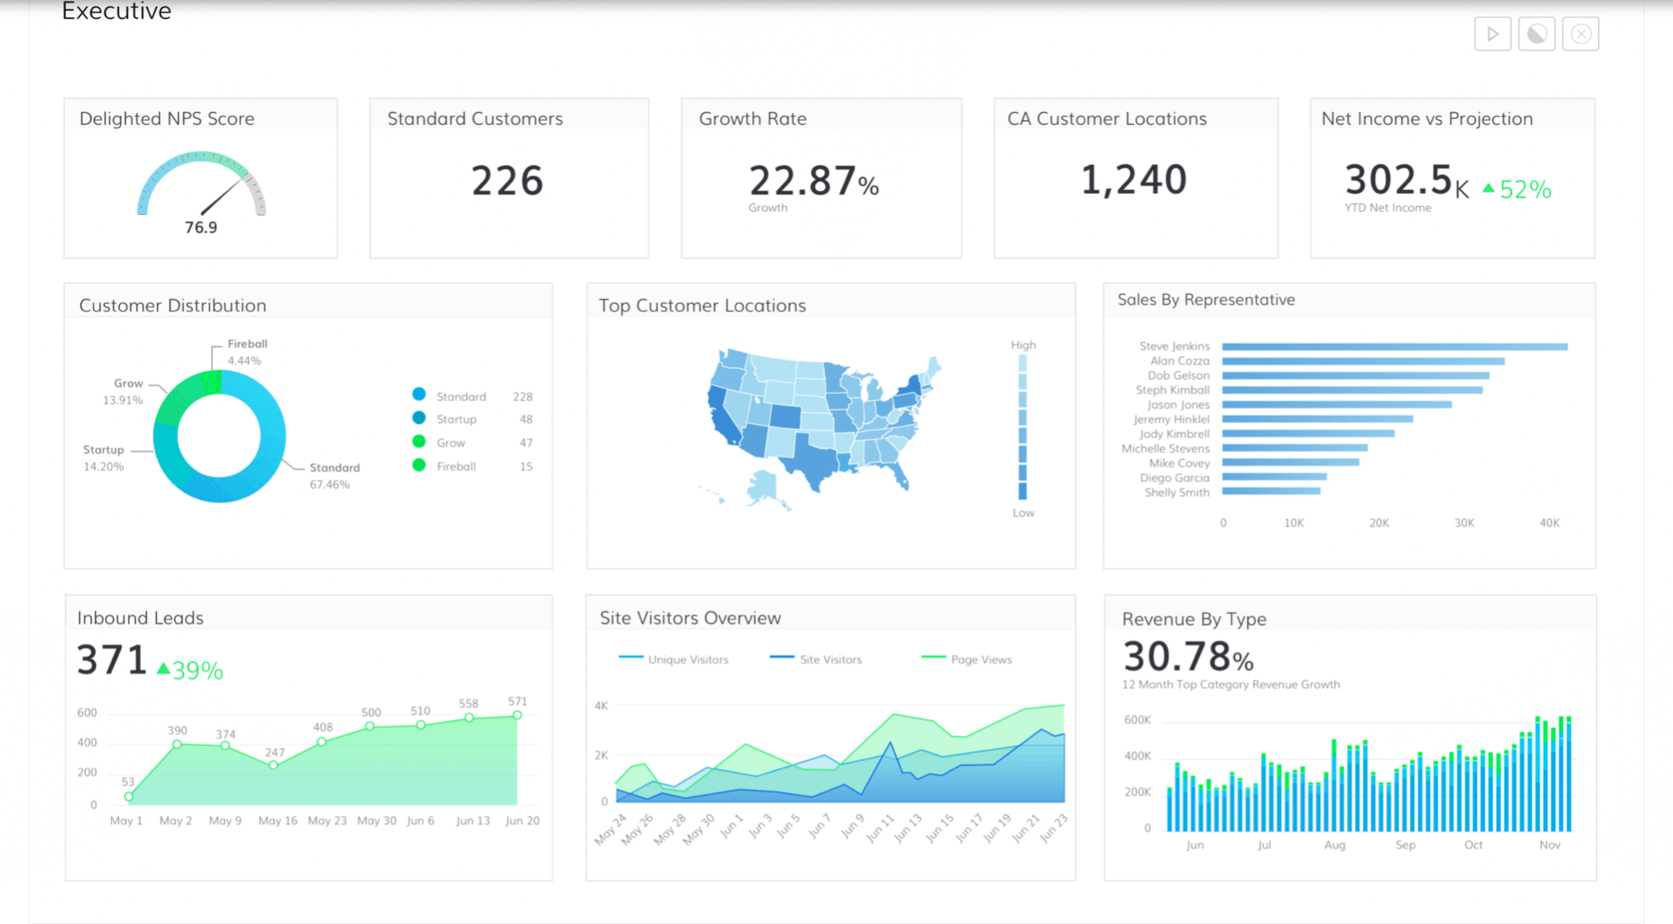
When you want to make sound business decisions, you need a tool that can help you parse huge swaths of data into digestible data points. Not only that, but the tool you choose should help you get others to understand your conclusions.
Data visualization tools make it easier for you to understand and get the most from your data as well as communicate with others.
Such tools provide information visually, which is especially helpful for presentations, project management, workflows, and business intelligence. Ultimately, you’ll get clear indicators of trends and present important information in a simple yet understandable format.
If you’re looking for a tool that can help you build custom infographics or interactive visualizations, here’s a list of the 15 best data visualization tools that will give you both the analytics and visualization you need.
15 Best Data Visualization Tools
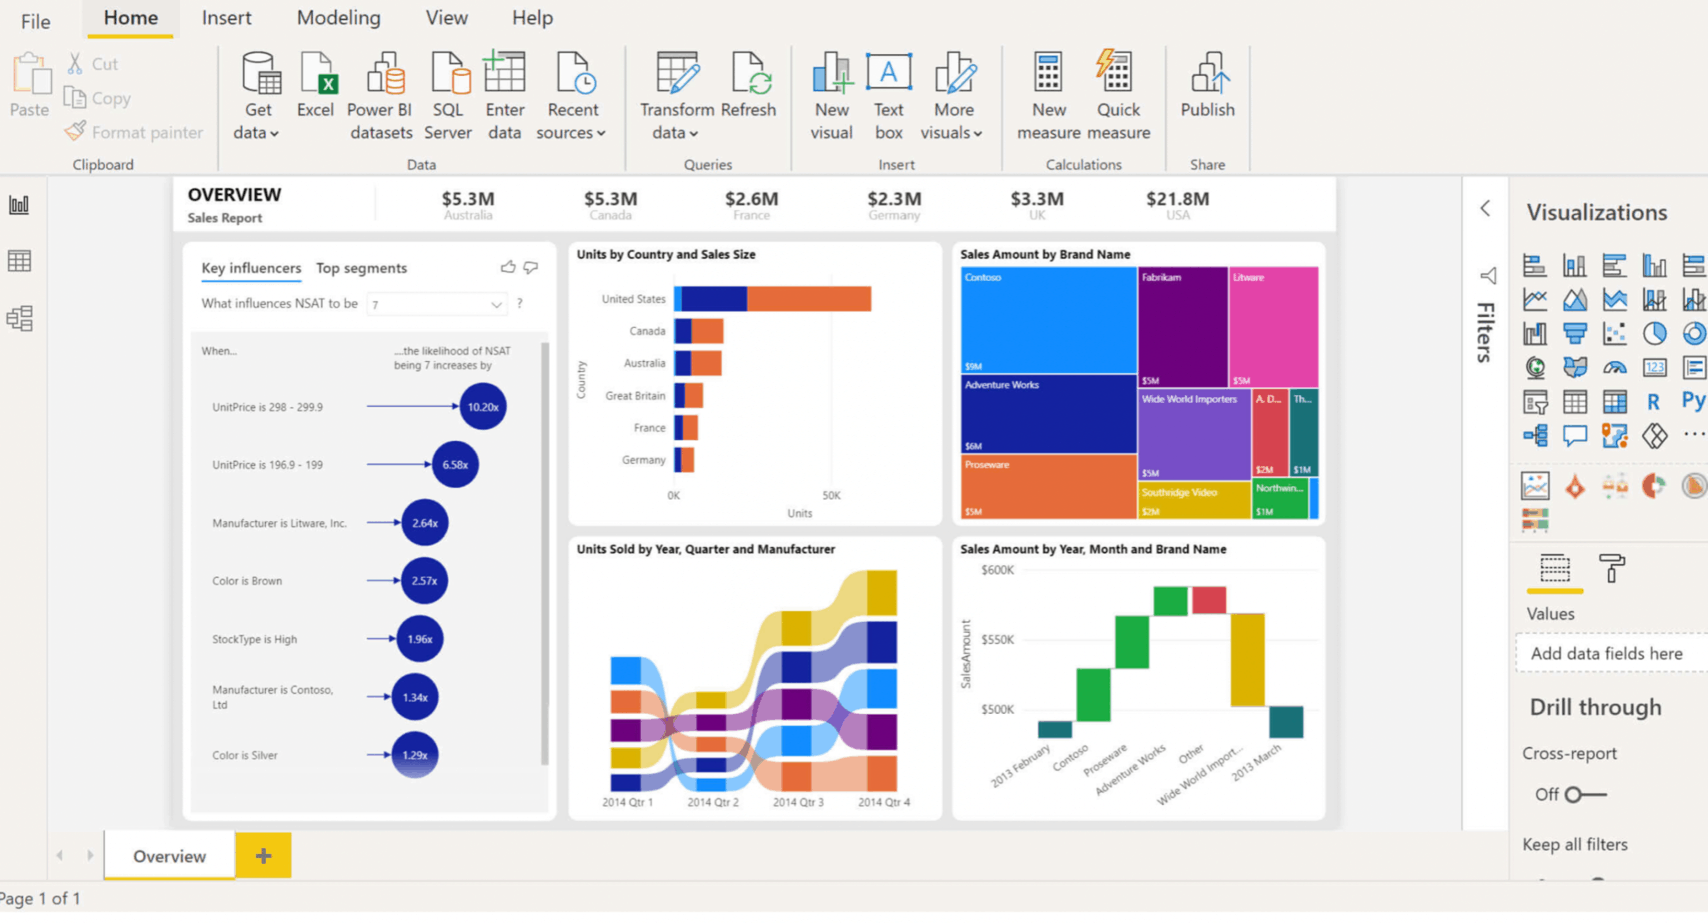
1. Microsoft Power BI
Microsoft’s Power BI is a suite of business analytics tools that’s popular for its top-notch data visualization capabilities, impressive usability, and superior compatibility with other Office products.
The tool allows you to import any data like folders, files, and databases. You can also view your data anywhere using a web-based editor, software, or mobile apps.
Unlike other data visualization tools, Power BI takes a totally web-based portal approach, and also has downloadable software, which lets you run your analytics via a reporting server or the cloud.
The tool is free for individual users but if you have a team, you can get a team package and anyone in your team can analyze data and make decisions anytime.
A trial period is available that provides some powerful features including the ability for you to connect hundreds of data sources and prep them for analysis on the fly. This way, you can create reports in a matter of minutes.
Also Read: Misleading Data Visualization Examples
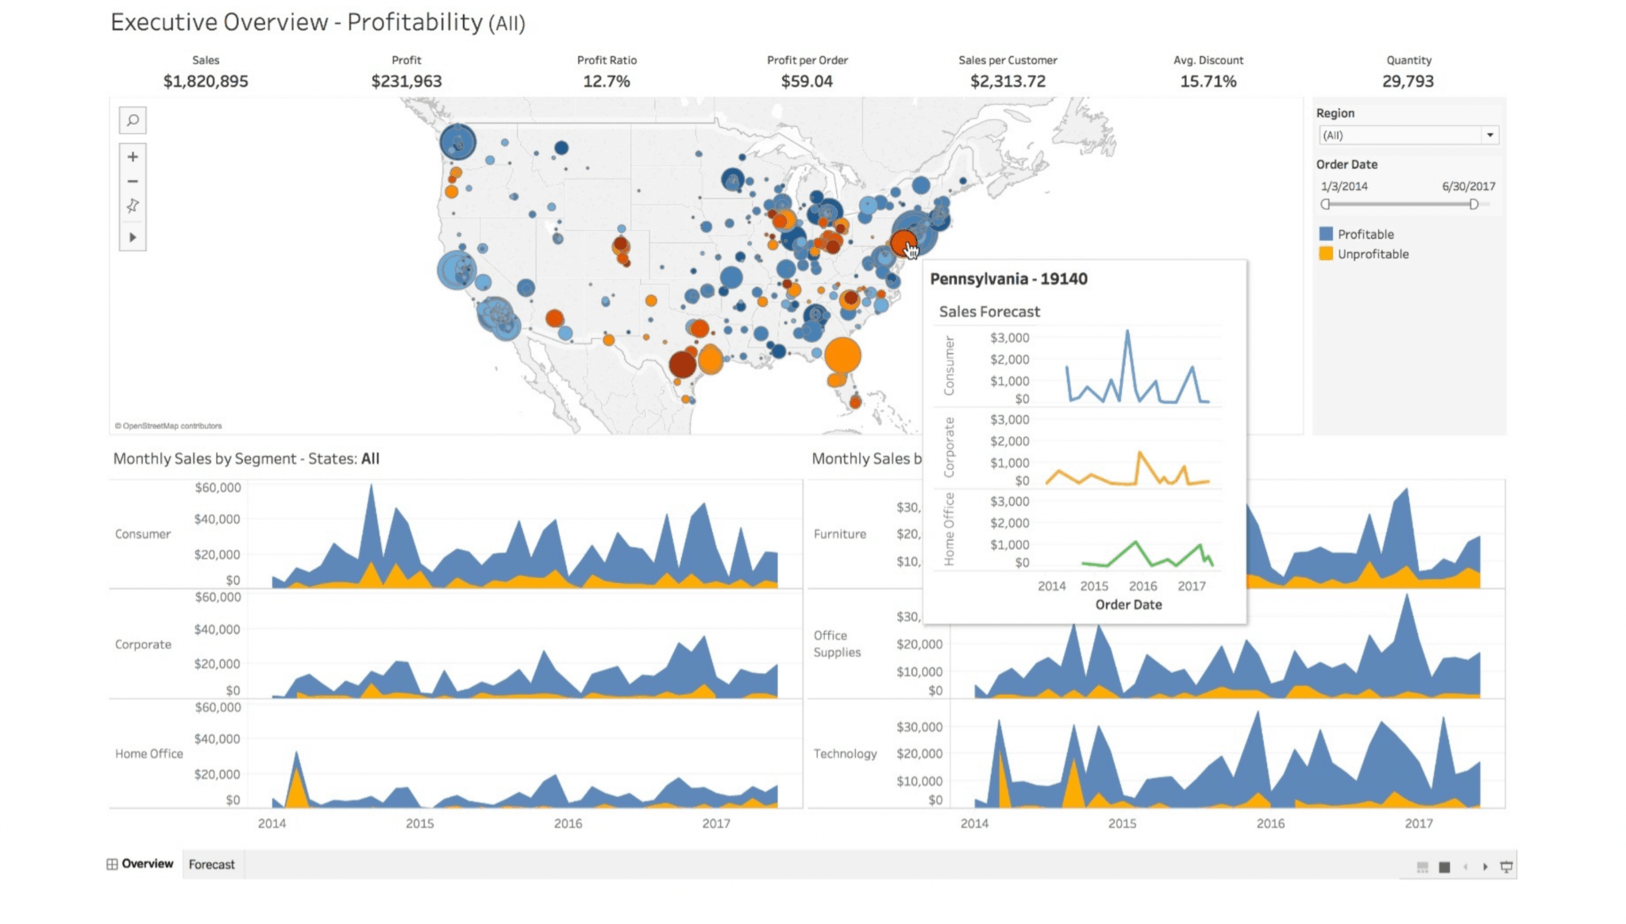
2. Tableau
Tableau is one of the mature data visualization tools on the market, which shows in its set of rich and powerful features. While it has a steep learning curve compared to other tools on this list, it’s one of the best you can get.
The tool provides comprehensive visualization, and you can implement it on-premise or in the cloud.
Among the strengths of Tableau are its big data and business intelligence visualization. The tool offers a range of different features including the Creator, which lets you use the software online or on your desktop device and process data to output visualized analytics.
For teams and organizations, Tableau is available as a standalone tool that offers data mining with interactive dashboards and visualization. You also get a version for live analytics processing with your existing software.
The powerful analytics and visualization tool produces different types of graphs and charts making it easier for you to communicate insights and respond to stakeholders’ questions.
Interesting Comparison: Tableau Vs Power BI
3. Sisense
Sisense is an extensible, infused analytics platform that allows you to embed analytics in your processes, workflows, business apps, and products. You can leverage the software’s set of APIs to create unique and fully customized data experiences for users anywhere.
The software is designed with knowledge graph technology so as to offer artificial intelligence throughout for you to make sense of data. It does this by highlighting impacts and insights, so all you have to do is type a question and get the relevant insights as well as a deeper investigation of the data regardless of your skillset.
You can scale Sisense across the entire analytics continuum to ensure the power of data is harnessed in every business decision.
Thanks to its comprehensive features, Sisense appeals to seasoned business intelligence users but novice users may find it frustrating.
The tool simplifies data analysis complexities by building in AI and machine learning into their platform. It’s so streamlined, you can go from raw data to visualizations in a short time.
You can create an analytics app using its API and any data set. This is especially helpful for large companies in manufacturing and health industries, among others. You can also create your own dashboards based on your needs and track any type of data.
The intuitive dashboard tool offers scatter plots, Sankey diagrams, and other interactive data visualization widgets.
4. Databox
Databox is a data visualization tool that offers multiple ways by which you can get your data into the software. These methods include connecting via any of its more than 70 integrations, sending via API or Zapier, or connecting to data stored in a SQL database or in Google Sheets.
By default, these integrations are loaded with thousands of metrics and pre-configured Datablocks as well as over 200 pre-made reports that you can set up in a matter of minutes.
Plus, you can use the Query Builder to build custom metrics that let you pull more granular performance insights without any engineering work. The Query Builder works with other tools including HubSpot Marketing, Google Analytics, LinkedIn and Facebook Calendars, Adobe Analytics, and more.
Databox helps you build pie charts, line graphs, tables, and other visualizations. As you update your data, the visualizations will automatically reflect the changes in Databox.
You can also push your data through Databox’s safe, fast, and simple API or send various metrics and events via Zapier to Databox.
The visualizations in Databox’s dashboards are richer and deeper in color, which is good if you like using dark mode on your device. You can also customize colors or legends, add interactive animations and buttons, and much more.
Check Out: Best Tableau Sales Dashboard Examples
5. Domo
For newcomers, Domo isn’t the best data visualization tool as it’s designed for companies that already have business intelligence experience in their teams.
This powerful, self-service, cloud-based data visualization and business intelligence platform comes with a slew of solid data visualization capabilities and data connectors. It integrates data sources and prepares the data therein for analysis, and then delivers powerful and helpful insights as well as predictive analytics.
The tool offers drag and drop integration and transformation features that allow for real-time visualization. The best part is that you don’t need technical experience or expertise to customize pre-built dashboards and visualizations.
Like other tools, you can connect your data using Domo across your enterprise and utilize their AI and machine learning capabilities to explore data on their own.
Other key features include the Magic ETL, which enables you to prepare your data without having to learn SQL and automatically suggested visualizations. It also comes with Domo’s Mr. Roboto AI engine, which powers predictive analysis and helps you create predictive models and use machine learning, AI, natural language processing, and other technologies that notify you about changes in your key performance indicators.
An Appstore is included for you to build your own dashboards and share them with others. You can also get training as a newcomer if you really want the features Domo has to offer.
6. IBM Cognos Analytics
IBM Cognos Analytics is an all-inclusive business intelligence solution for more reliable and fast data preparation and reporting.
You can connect your data effortlessly by importing it from spreadsheets or CSV files into your on-premises or cloud data sources including Amazon, Redshift, and SQL databases.
The software also allows you to automatically prepare and connect data, which helps you save time cleaning your data using AI-assisted data preparation. Plus, you can create dynamic dashboards by dragging and dropping data.
If you’re working with a team, you can drill down for more detail and share via Slack or email. Moreover, you can keep your team and stakeholders updated automatically, by creating and sharing dynamic, multi-page, and personalized reports in the formats they want.
IBM Cognos Analytics helps you get deeper insights even if you don’t have a data science background. You can also use the new mobile app to stay connected on the go and access data or alerts anytime from your phone.
Explore: Best Tableau Retail Dashboard Examples
7. Xplenty
Xplenty is an advanced, cloud-based data pipeline and integration platform that’s intuitive and easy to deal with. The platform is a complete toolkit for you to build data pipelines using the workflow engine and rich expression language to implement complex data preparation functions.
You can connect and integrate a wide range of SaaS apps and data repositories. Plus, the software offers low-code and no-code options so you can easily add them to your data solution stack.
Xplenty also has an API component for advanced flexibility and customization and connects the software with your existing monitoring system using Xplenty’s service hooks.
The elastic and scalable cloud platform can handle deployments, scheduling, monitoring, security, and maintenance of your operations while you remain focused on your data.
8. Zoho Analytics
Zoho Analytics is a self-service data visualization and business intelligence tool that has a cloud-based approach to how you handle your data. The tool is designed for general business users who may not be experienced in analytics software and helps you collect data from multiple sources.
The platform offers visually attractive dashboards and it integrates data from various files including URL feeds, Microsoft Office documents, and databases like MySQL along with apps from Zoho. Besides the Zoho ecosystem, you can also integrate data from Dropbox, Box, Google Drive, and other apps including Google Analytics, Salesforce, and QuickBooks.
You can then blend the data via statistical and integrated mathematical formulas. You can use the simple online interface and functions with reports that can be printed, emailed, or viewed via the portal.
Zoho Analytics has a free plan, but you can upgrade to the paid plans to access premium features, forecasting, smart data alerts, and more.
9. SAP Business Objects
SAP is a global leader in the cloud business software segment with more than 200 million users who prefer it for its intelligent technologies and leadership across business processes.
The platform offers a wide range of features including data management for analytics and you can use it to harness data company-wide. This way, you can gain and share unprecedented insights to compete in today’s digital economy.
With the SAP Lumira software, you can promote insight across your organization thanks to the self-service business intelligence discovery and visualization. With these, you get analytic apps and interactive dashboards to help you organize and understand your data easily and quickly.
The tool can be deployed on-premises or in the cloud. Its single, simple design canvas helps speed adoption and foster collaboration between your company and IT teams.
Plus, you get inclusive self-service analytics, real-time performance, and insights for storytelling purposes so that other users can leverage, build on, and share the data.
10. Chartio
Chartio is another cloud-based data visualization and business intelligence tool.
The software is designed with experienced business intelligence users in mind as it excels at building a powerful analytics platform for them. This means that new users to the business intelligence space may find Chartio a bit difficult to use.
You can use Visual SQL to retrieve and analyze data without having to learn any code. This way, data analytics will be available to everyone on your team including engineers and marketing professionals.
Chartio also gives you access to continuous training and support. As your business needs grow, the support staff at Chartio can point you to tools that will be beneficial to help you make better business decisions.
Among the powerful features Chartio provides include visual analytics for easy-to-understand reports and customizable dashboards that support KPI monitoring and data source integrations. Chartio connects to all major cloud databases.
Chartio recently joined Atlassian so it will be shutting down in March 2022. The Atlassian platform’s goal is to centralize and connect data across their products and third-party tools. This way, teams can get unique insights that will help them drive their business decisions.
11. Datapine
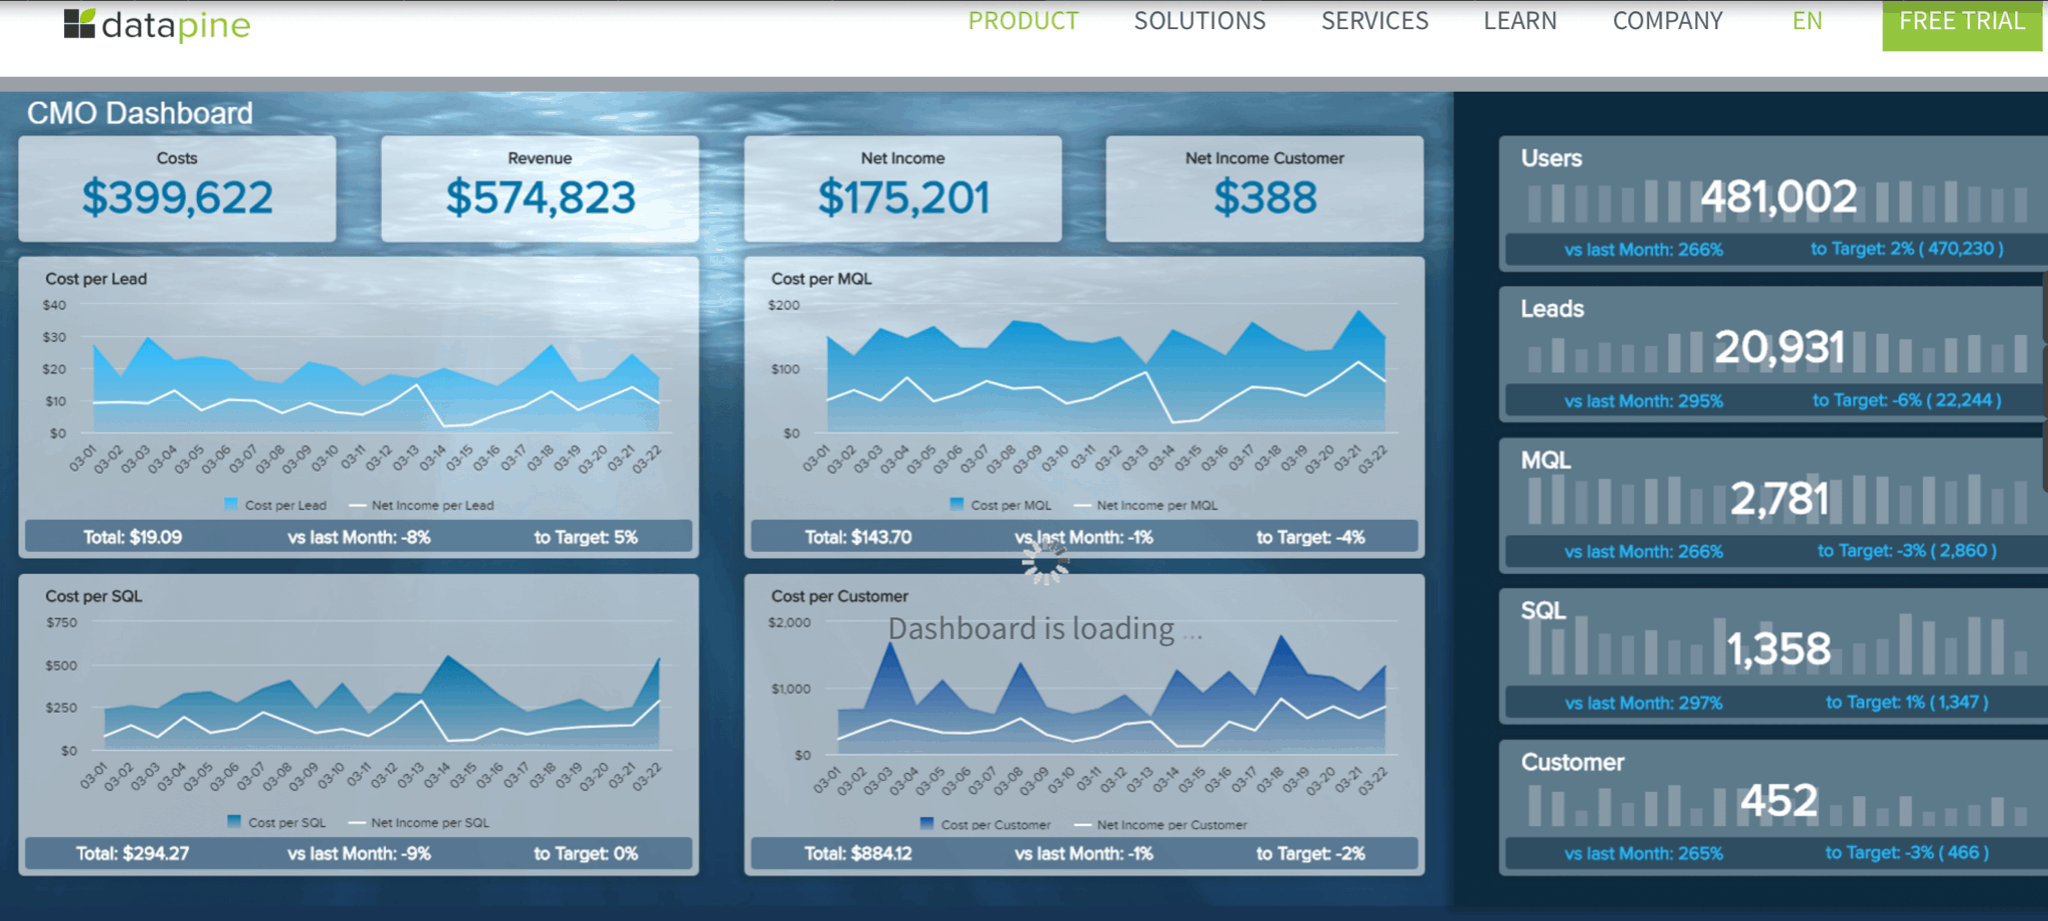
If you want to give you and your teams secure access to your company’s data, Datapine is worth considering. The software offers interactive business intelligence dashboards that enable you to make data-driven decisions anywhere and at any time.
You get easy access to all the relevant metrics that help you understand your business and react to unexpected events. The user management is not only comprehensive but lets you share interesting dashboards with particular people or full departments securely.
Datapine helps you benefit from a modern business intelligence platform. You can empower your team to generate actionable insights with self-service analytics while leveraging a secure, single source of truth of all your sources of data in one central platform.
In addition, you get to do work faster, reduce manual tasks, and be flexible thanks to the scalability of this SaaS business intelligence solution. You also get to share, predict, and monitor data based on predictive analytics, effective reporting, and AI-based data alerts.
12. Whatagraph
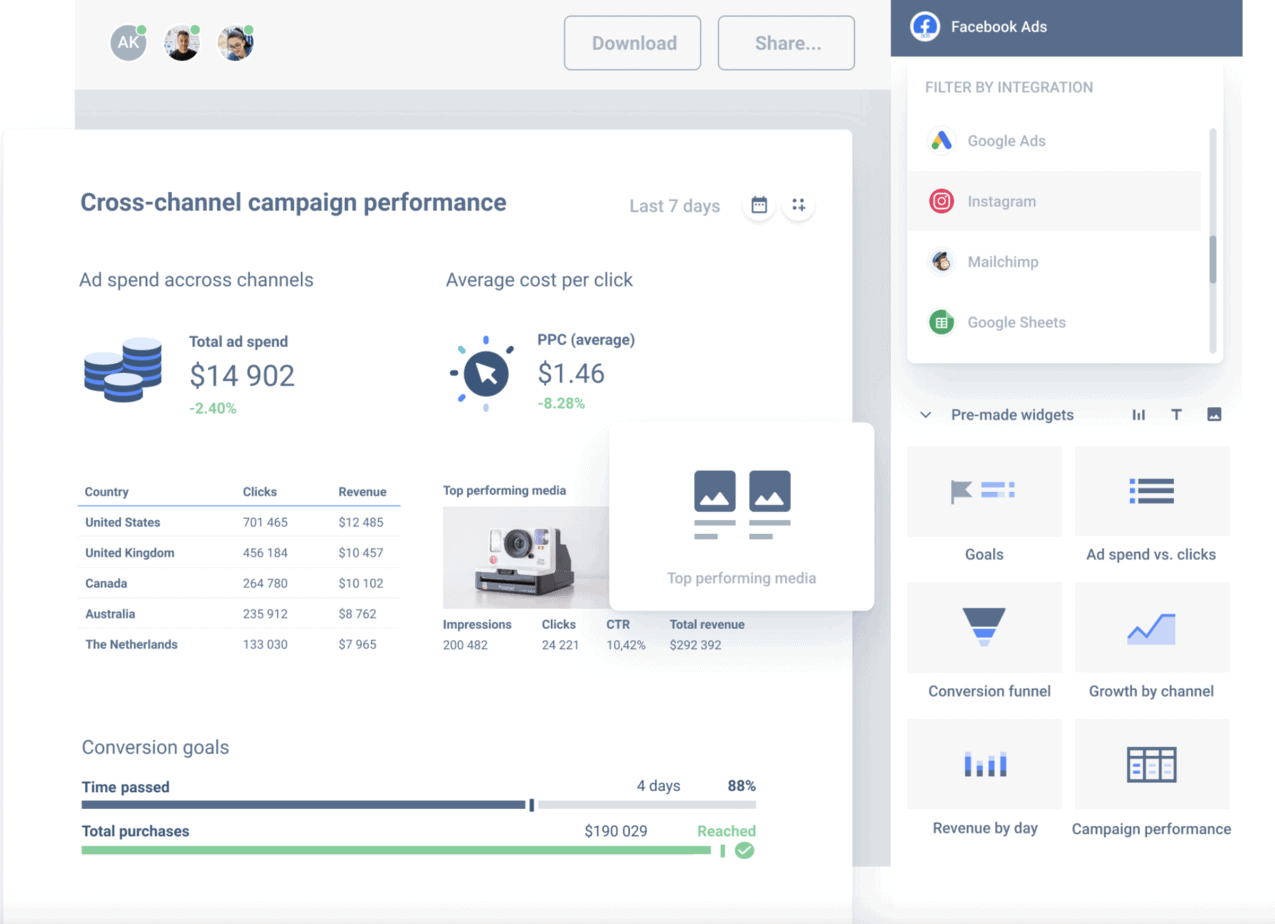
Whatagraph is a performance monitoring and reporting tool that simplifies data visualization tasks for businesses and agencies across the world.
The tool is used to visualize data and build tailored reports across multiple channels. Once you connect your account to the software, it gathers all your performance data and transfers it to the platform.
Whatagraph’s data pulling process is automated so you don’t have to do manual data collection again. You can blend data from several sources, create multi-channel reports and compare how one or more campaigns perform against each other across multiple channels.
You can select from more than 30 integrations including HubSpot, Facebook, Google Analytics, and more.
Plus, you can build easy-to-read and visually appealing reports to help your stakeholders and/or clients understand the data or share links to the reports generated by the tool for easy anytime access.
Whatagraph also lets you build your own widgets by connecting to its API directly to show the data that matters to you. Anyone from social media managers and marketing executives to online store owners, CEOs, bloggers, and account managers among others can use the software.
13. QlikView
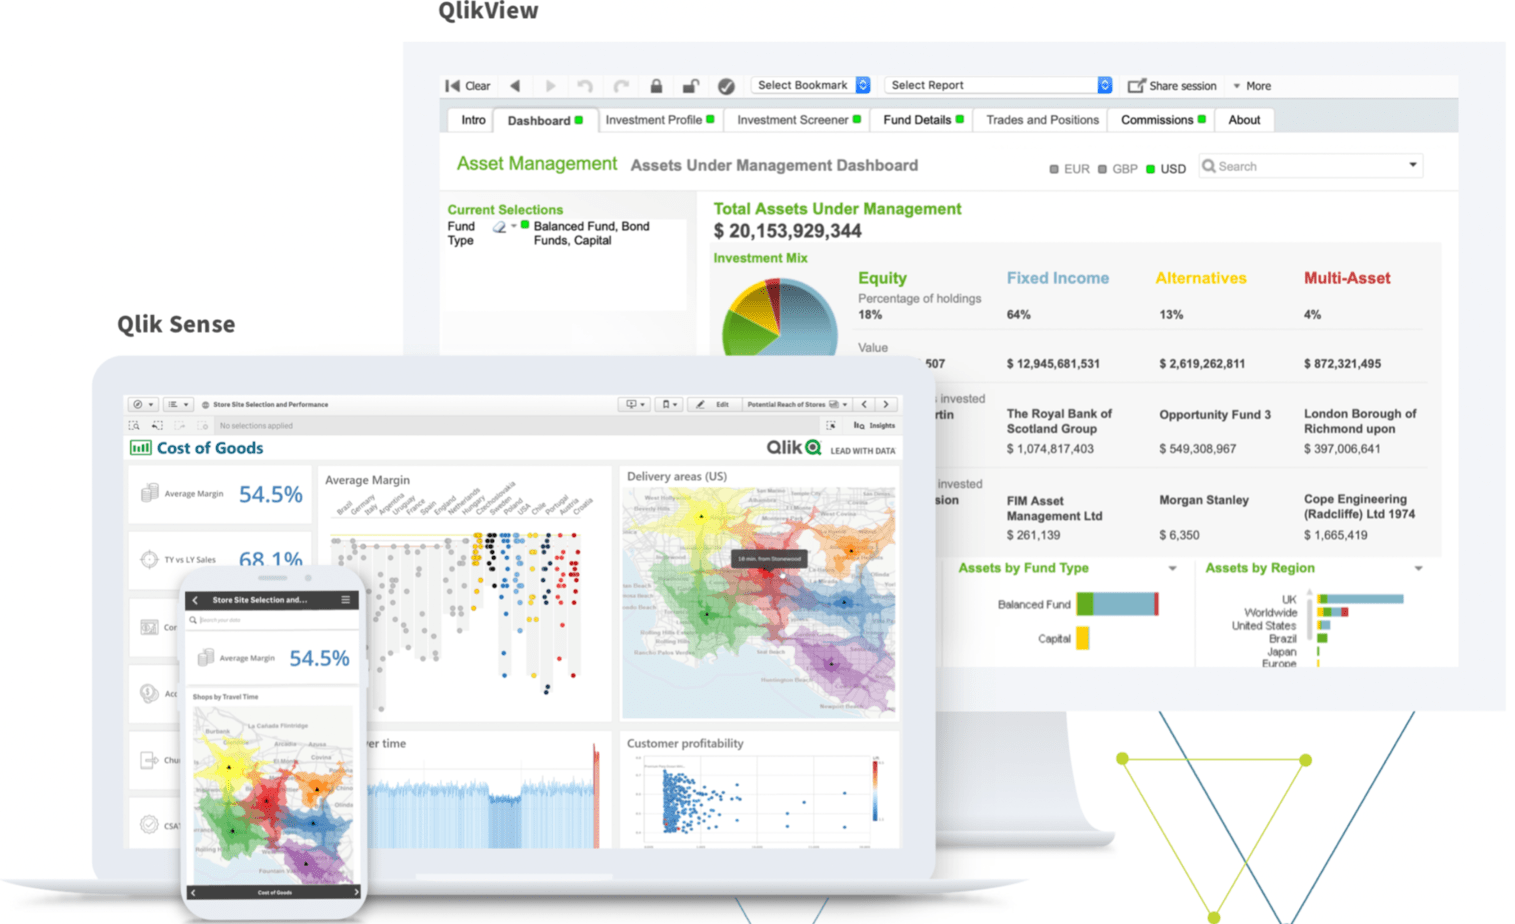
QlikView is a business intelligence solution that helps you build your own guide analytics apps using system-gleaned data and insights. This way, you can respond faster to any changes in requirements and provide valuable insights to apply across your business.
You can find hidden trends and patterns using the Associative Data Indexing Engine feature to inform your business decisions and actions. The engine also helps you uncover data relationships and insights across multiple sources and improve the quality of your decisions.
The software offers custom and default data connectors as well as open database connectivity connections for seamless data flow between different systems. Its open API ensures that the software can easily blend in any ecosystem thereby eliminating the need for multiple data processing systems.
You can also use QlikView in the cloud or choose your preferred deployment method. Alternatively, you can buy a license for a certain number of tokens or use both tokens and cloud deployment.
QlikView reveals connections you won’t easily find with standard tools, unlike traditional systems. The tool also helps you render insights and decisions through its strong collaborative capabilities as you discuss data and insights with your team in real-time.
14. Looker
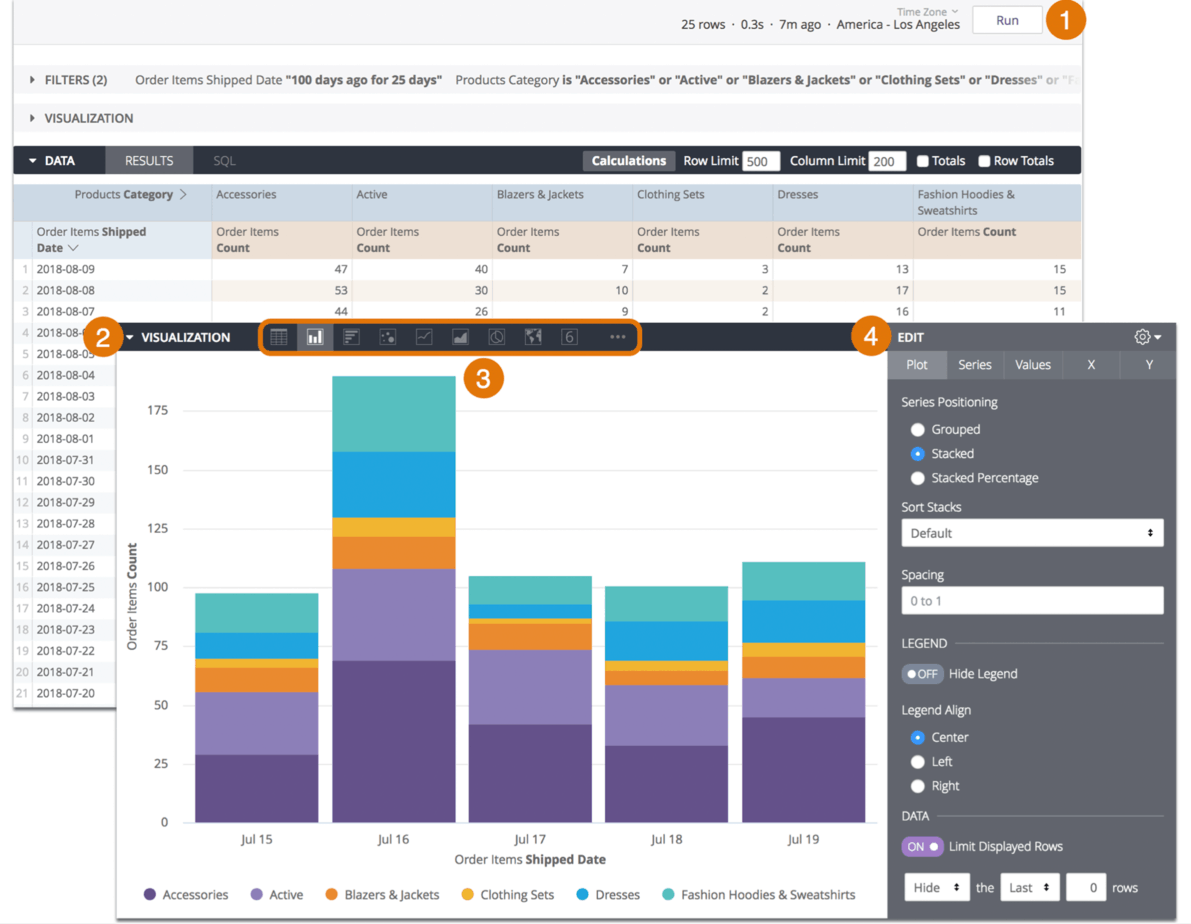
Looker is a data visualization tool that’s now a part of Google Cloud. Together, the tools bring the power to connect, analyze, and visualize your company’s data across multiple cloud environments.
The platform allows anyone in business to analyze and discover insights quickly in your datasets. It also makes it easy for you to build a data exploration platform from where you can access data easily in a meaningful and intuitive way for the whole company.
With Looker, you can tell better and brighter stories with your data and see the whole picture in order to turn the data into insights that power better business decisions.
Interactive and dynamic dashboards and data visualizations are included to give you the flexibility you need to drill down into your data and still maintain a birds-eye view of your operations.
You can organize your data using maps, funnels, timelines, Sankey, treemaps, combined charts, or create your own visualizations. The tool also helps you detect changes and irregularities in your data and bring more impact to your presentations.
15. Visme
Visme is a data visualization tool that offers a full set of tools including chart templates, a graph maker, and a data widget library. You can create your own types of data visualization for any project you work on in Visme like a presentation or report.
The software helps you create data visualizations by integrating business intelligence and interactive design, making it easier to read and understand, besides looking stunning.
You can create pie charts, line or bar graphs, histograms, scatter plots, and more chart styles. Plus, you can use the data widgets to visualize arrays, tables, map data, gauges, percentages, and more.
Visme also imports live data from Google Sheets and you can track business insights by creating custom dashboards.
The software is not just for professionals but anyone who needs to create visual graphics and visualizations for various purposes including bloggers, students, and social media managers.
Wrapping Up
Data visualization tools are critical for any serious business owner. Not only do they help you deal with huge data but they also help with business decision-making.
Any of these 15 best data visualization tools can get the job done, but you need to evaluate the features and capabilities carefully to find one that can fully meet your needs.
Tom loves to write on technology, e-commerce & internet marketing.
Tom has been a full-time internet marketer for two decades now, earning millions of dollars while living life on his own terms. Along the way, he’s also coached thousands of other people to success.
